Conditional Entropy
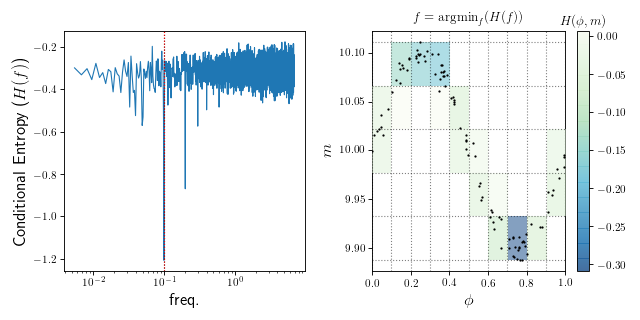
The conditional entropy period finder [G2013] phase-folds the data at each trial frequencies and estimates the conditional entropy \(H(m|\phi)\) of the data. The idea is that the data with the least entropy (intuitively: the greatest “structure” or “non-randomness”), should correspond to the correct frequency of a stationary signal.
Here,
where \(p(m, \phi)\) is the density of points that fall within the bin located at phase \(\phi\) and magnitude \(m\) and \(p(\phi) = \sum_m p(m, \phi)\) is the density of points that fall within the phi range.
(Source code, png, hires.png, pdf)
An example with cuvarbase
import cuvarbase.ce as ce
import numpy as np

# make some fake data
t = np.sort(np.random.rand(100))
y = np.cos(2 * np.pi * 10 * t)
y += np.random.randn(len(t))
dy = np.ones_like(t)

# start a conditional entropy process
proc = ConditionalEntropyAsyncProcess(phase_bins=10, mag_bins=5)

# format your data as a list of lightcurves (t, y, dy)
data = [(t, y, dy)]

# run the CE process with your data
results = proc.run(data)

# finish the process (probably not necessary but ensures
# all data has been transferred)
proc.finish()

# Results is a list of [(freqs, CE), ...] for each lightcurve
# in ``data``.
freqs, ce_spectrum = results[0]
If you want to run CE on large datasets, you can do
proc.large_run(data, max_memory=1e9)
instead of run, which will ensure that the memory limit (1 GB in this case) is not exceeded on the GPU (unless of course you have other processes running).
| [G2013] | Graham et al. 2013 |